Get Integrated Level Fluxes For Solar Reflected and Thermal Radiation
Here in this notebook we work on getting the pressure-dependent level fluxes and also comparing these level fluxes with our three methods of getting opacities (resort-rebin, resampled, and preweighted)
[1]:
import picaso.justdoit as jdi
import numpy as np
import picaso.justplotit as jpi
WARNING: Failed to load Vega spectrum from /data/reference_data/picaso/ref4/stellar_grids/calspec/alpha_lyr_stis_011.fits; Functionality involving Vega will be severely limited: FileNotFoundError(2, 'No such file or directory') [stsynphot.spectrum]
[2]:
import os
mh = '0.0'#'+0.0' #log metallicity
CtoO = '0.46'# # CtoO absolute ratio
ck_db_path = os.path.join(os.getenv('picaso_refdata'),'opacities', 'preweighted', f'sonora_2121grid_feh{mh}_co{CtoO}.hdf5')
sonora_profile_db = os.path.join(os.getenv('picaso_refdata'),'sonora_grids','bobcat')
Grab the thermal fluxes, reflected fluxes, and pressure levels from the full output
[4]:
# Get the data out of the picaso run
thermal_plus = df['ck']['full_output']['level']['thermal_fluxes']['flux_plus']
thermal_minus = df['ck']['full_output']['level']['thermal_fluxes']['flux_minus']
reflected_plus = df['ck']['full_output']['level']['reflected_fluxes']['flux_plus']
reflected_minus = df['ck']['full_output']['level']['reflected_fluxes']['flux_minus']
pressures = df['ck']['full_output']['level']['pressure']

# Sum the binned fluxes to get the bolometric values
integrated_thermal_plus = np.sum(thermal_plus, axis=1)
integrated_thermal_minus = np.sum(thermal_minus, axis=1)
integrated_reflected_plus = np.sum(reflected_plus, axis=1)
integrated_reflected_minus = np.sum(reflected_minus, axis=1)
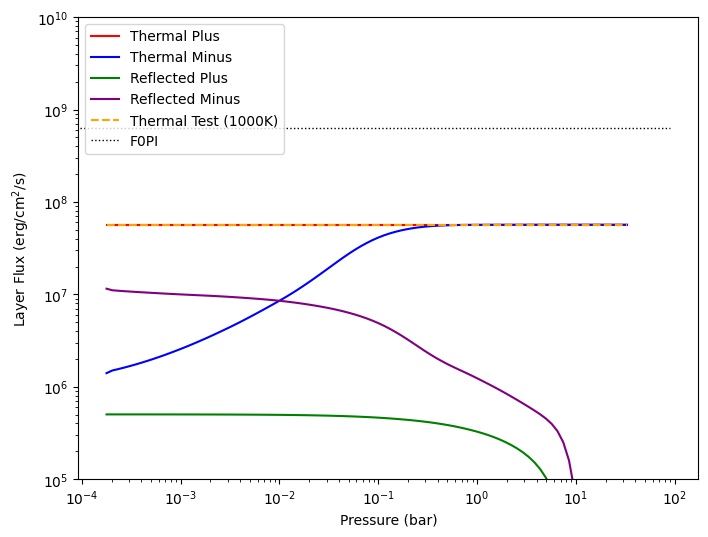
Plot the thermal and reflected layer fluxes
[5]:
# Compute incident flux
plt=jpi.plt
F0PI = (5.67e-5 * stellar_temp ** 4) * (((stellar_radius * rsol) / (orbital_sep * au)) ** 2)

plt.figure(figsize=(8, 6))

# Plot thermal and reflected fluxes, both up and down
plt.plot(pressures, integrated_thermal_plus, label='Thermal Plus', color='red')
plt.plot(pressures, integrated_thermal_minus, label='Thermal Minus', color='blue')
plt.plot(pressures, integrated_reflected_plus, label='Reflected Plus', color='green')
plt.plot(pressures, integrated_reflected_minus, label='Reflected Minus', color='purple')

# Add reference flux lines for thermal and starlight
plt.plot(pressures,
         [5.67e-5 * blackbody_temp ** 4] * len(pressures),
         label='Thermal Test (1000K)',
         color='orange',
         linestyle='dashed')

plt.plot([np.sum(F0PI)] * len(pressures),
         label='F0PI',
         linestyle='dotted',
         linewidth=1,
         color='black')

plt.xscale('log')
plt.yscale('log')
plt.ylim(1e5, 1e10)
plt.ylabel(r'Layer Flux (erg/cm$^2$/s)')
plt.xlabel('Pressure (bar)')
plt.legend(loc='best')
[5]:
<matplotlib.legend.Legend at 0x7f30b82f9400>